Moving Health Forward Together
At Bionano, we strive to elevate health and wellness for all people through customer-centered innovations that transform the way the world sees the genome.

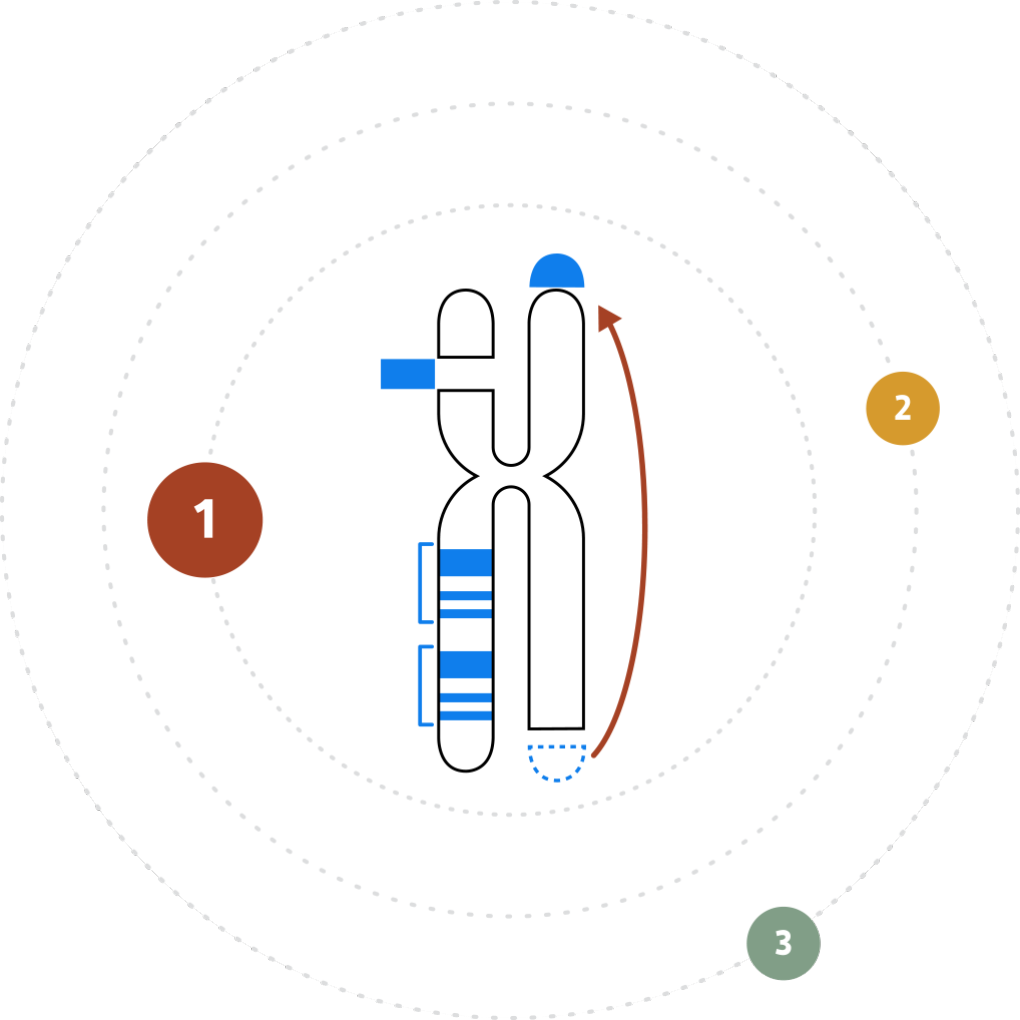
The inability to resolve the continuum of genomic variation—from single nucleotide variants (SNVs) to structural variants (SVs) up to chromosome-arm scale—is holding us back from comprehensive disease identification and treatment.
Tools such as karyotyping, FISH and chromosomal microarray (CMA) lack the digital resolution and efficiency to resolve SVs at scale. Next-generation sequencing (NGS) struggles with larger structural variants and highly repetitive regions of the genome.
Bionano optical genome mapping (OGM) solutions address this critical gap.

Bionano OGM solutions provide the essential tools clinicians and researchers need to reveal actionable insights from all classes of genomic variation.
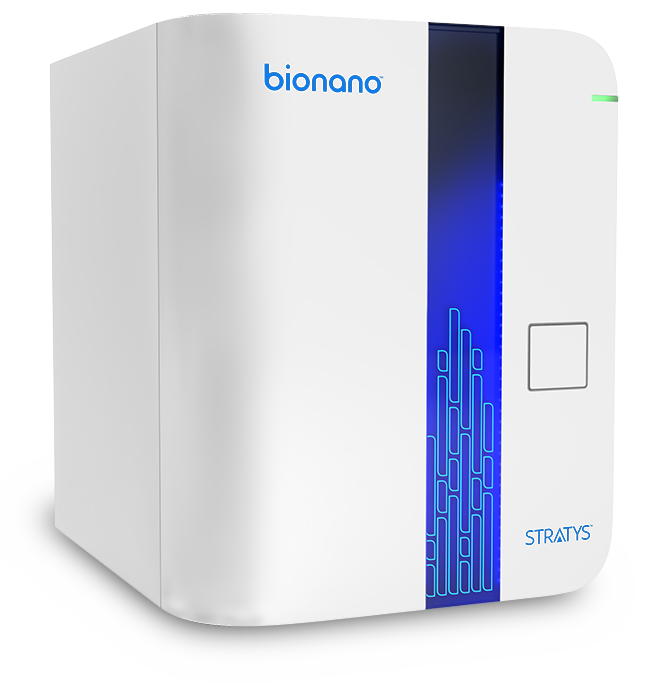
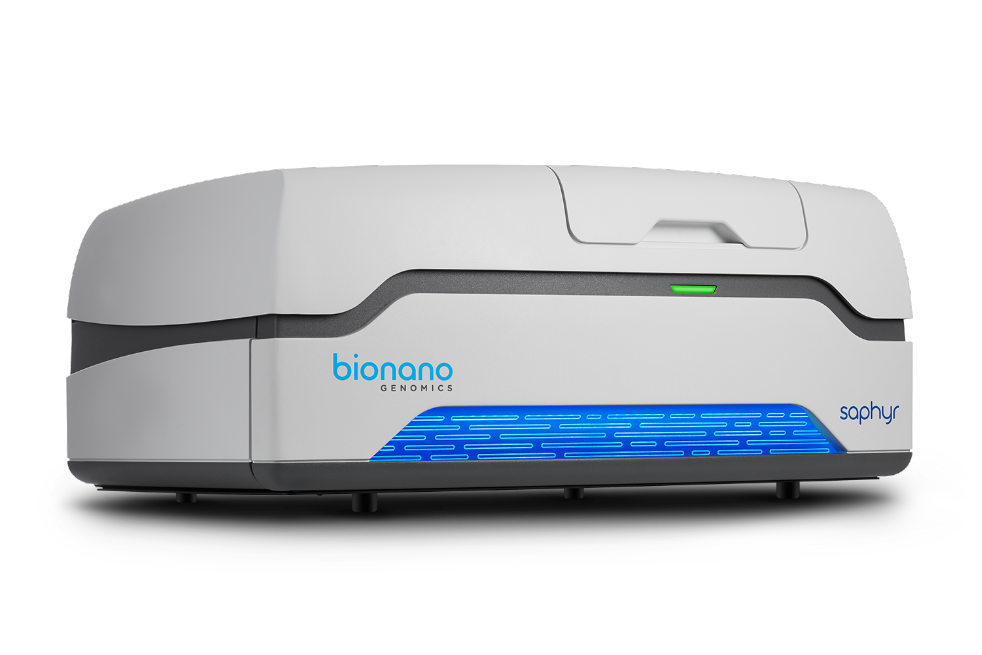
- Bionano OGM Mapping Systems—Provide the data other tools miss with digital precision in a rapid, highly automated workflow from sample preparation through primary data analysis.
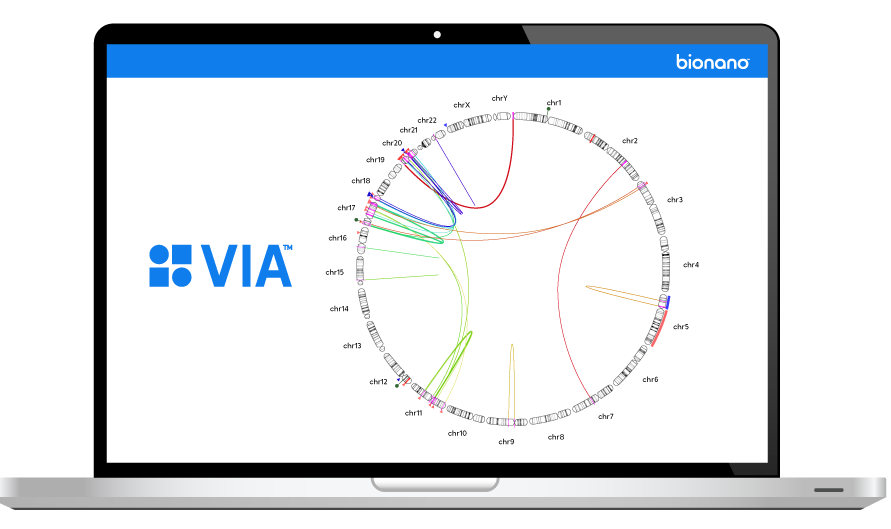
- Bionano Analysis Software—Brings OGM data together with NGS, CMA and other data types in one view for truly comprehensive interpretation and analysis of variant data.
Our solutions are backed by a support team dedicated to empowering you to move forward.
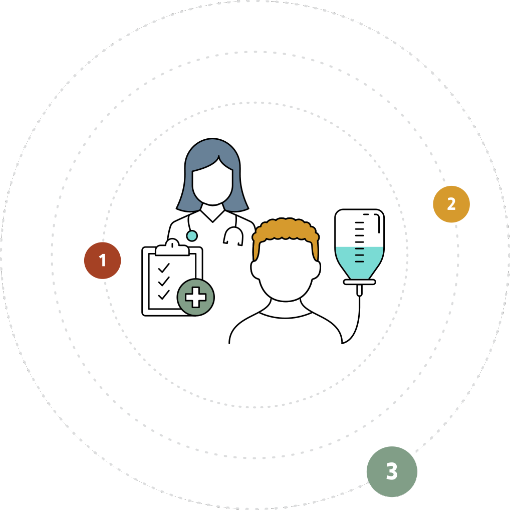
OGM users worldwide are making breakthroughs across a wide range of disease states. Over 500 publications cite OGM solutions, and that number is quickly climbing.
Our customers’ discoveries in cancer and genetic disease reveal the variations responsible for deleterious effects as well as new druggable targets hidden from view until now.
Together, we are moving health and hope forward for patients and their families forward.